HW3-Digital_cut_up- Thesis Review by Sebastian Morales

For this assignment we take two or more texts and combining together using random, lists and list expressions. In this case the takes my thesis proposal and mixes it with my thesis feedback review:

Here a couple of samples:

which brings together art, seems human input is
The University of Surrey, wonderful cell biologist at
the form of bursts could include more of
regulate gene expression and, is a book about
to pass signals between or is sebastian ultimately
the Internet by being execute this on a
and Alfred Renyi, who protozoa. Are we talking
communication was detected using genetics named Timothee Lionnet
engage the audience with how will they alter


programmer specialising in artificial like the concept of
recently discovered by Bonnie description could include more
form of bursts of "post-human". Will bots have
potential of a powerful this will work technically
to map the world description could include more
it cannot produce the release different type of
white pixels become purple (for future reference :)
research takes a threefold description is good. I

Following is the actual jupyter code:

Generated Poetry + Embedding Jupyter into Squarespace by Sebastian Morales

Inspired by a trip to Trader Joes one rainy afternoon

Embedding Jupyter Notebook into Squarespace:

First upload it to Github, then create a iframeable url at http://nbviewer.jupyter.org/ 

Then simply embed as an iframe: 
<iframe src="https://nbviewer.jupyter.org/github/sebmorales/itp_RWET/blob/master/HW/some-poetry-generators.ipynb" width="100%" height="3600" scrolling="yes" frameborder="0"></iframe>
 

*Note: make sure the url is secure (https), if not it won't load for security reasons.

transcribing identity by Sebastian Morales

Start by going 16.6 units at a 133.6 degrees, once you reach there you are going to move in an arc motion. The arc should be tangent to the movement you just did. The arc has a radius of 6.1 units; continue walking that arc for 153.3 degrees in the anti-clockwise direction. At this exact position walk tangentially for 10.5 units. You have arrived to the first decision point; you have the option to go in one of three directions. Left, right, or center [decision 1]. Strangely in this map, the paths are parallel and may merge in the future so don't think it too much. You will go left and see what happens. Walk 14.2 units east and 15.9 units north. It is best if you do the previous two steps in a single hypotenuse motion. Walk a tangential arc of a radius of 9.36 units, this arc goes in the anti clockwise direction for 119.3 degrees. At the exit, keep straight with that inertial direction for 16.4 units, be prepared, a long complicated curve awaits.

The curve is a type of curve called a spline. In this case, this spline has a beginning, an end, and three intermediate points. Unlike a polyline, a spline is not the simple connection of lines with points. In a spline, each intermediate point has two control points. These control points have the unique characteristic that when connected, the center is the main point, and the line formed is tangential to the curve at that point. The distance between control points also influences the radius of the curve at that point, the longer the control line, the larger the radius of the curve at that point. With this knowledge, the first point is exactly where we are.

The control line is tangential to our direction and has a length of 16.4 units, from there, the following point is 29 unites west and 11.2 units south. The control line has a slope of 1 and a length of 12.3 units. The following point is 20 units south and 14 units west. This time the control line has a slope of 2.25 and a length of 21.7 units and a slope of -0.93.  The fifth and last point in the spline is 53.9 units east and 10.7 units south from here. It’s control line measures 23.12 units, and has a slope of  0.21. Here we will do a long arch, the arch continues tangentially for 63.5 degrees and has an arch of  78.8 units. From this point you will start another arch in the same general direction, also tangential to where we are. The arch has a radius of 43.7 and you will walk it for 39.1 degrees. 

Things take a slight change now, so far the path has have the regular shape of a spiral, but now the direction will change. Still tangentially, but now in a clockwise direction, you will walk a short angle, only 9.5 degrees but a radius of 442.0 units. 

You have reached one possible end of the image. 

Wifi and how it works, lets get physical by Sebastian Morales

The following article was commissioned by Tom Igoe for his class Understanding Networks. It is an explanation on how wifi works on the physical layer. 

For quite a while I have been wondering about how wifi works, not so much in the context of protocols, although that is certainly part of it, but in the physical sense of information traveling through the air around us. By writing this article, I realized that I could not answer this question without going beyond wifi, so this article also goes into how radio works.

The article is structured in layers, this reflects the way I have been learning about the subject. It also means that you can stop reading at any point with a better (hopefully) understanding of how Wifi works. But... if you are still curious keep reading.

Before I begin however, let me share of the assumptions I have about you; I expect you to know a little about how you computer connects to the internet. Not necessarily about how things work, more in the realms of knowing that they exist. Things like: routers, local network, wifi cards, radio and electromagnetic waves. If some of this terms are completely unfamiliar, maybe it is time to do a quick wiki search. Ah, also some basic color theory will come in handy.

A little about Wifi or should I say, IEEE 802.11?

Did you know that Wifi actually stands for... nothing. Apparently, when the Wireless Ethernet Compatibility Alliance was looking for new branding they realized they "needed something that was a little catchier than IEEE 802.11b Direct Sequence" 1 and they came up with WIFI, not as an acronym but as a word. Now a days we rarely think about things like ethernet (or IEEE 802.3), although we use its wireless version every day. The "IEEE 802" part of the name refers to networking standards for local, metropolitan, and area networks, these can be using an open or an accredited process. The ".11" specifies local area networks, sometimes also called LAN.

Lets start with the simplest of scenarios, how does a wifi modem communicate with one device (talking physics)?

The answer to this question goes beyond Wifi into digital radio. Digital radio is very similar to and AM or FM radio with the difference of sending information as bits instead of analog signals.

Radio works by taking a wave (called a carrier wave) and modifying it with information. Lets look at the equation for a sine wave to determine what parameters can be modified:
sinewave
This equation tell us that there are 3 parameters we can change:

  1. 'A'or amplitude,
  2. 'ω'or frequency of the waves
  3. 'phase' or the phase of the wave

With these 3 parameters we can make many different types of digital modulation but the most common are FSK, ASK and PSK. The following sketch illustrate the basic of how a message could be encoded using Frequency Shift Keying (FSK), Amplitude Shift Keying (ASK) and Phase Shift Keying(PSK):

The 3 types can be used but FSK is by far the most used one, it is in part because it is less sensitive to disturbances by other waves. When two or more waves pass through each other, their amplitudes at each given point will add up. This makes ASK specially susceptible to noise while FSK is still somewhat decodable. It is important to know that a lot of noise will bring down any signal no matter the encoding. Feel free to play with the following sketch to observe how different modulation systems behave under disturbances.

These sketches illustrates the most basic form of modulation. In practice more information is encoded using the same concept. For example lets suppose that instead of only using two frequency rates (0,1) we used four (00,01,10,11), then each bit of transmission could encode two bits. This makes the transmission 2x faster but also needs 2x the frequency bandwidth (more about frequency bandwidth later).

How does router talks to multiple devices on its network?

Now that we know that from a protocol standpoint, Wifi is just wireless ethernet, we can skip much about how the router address each device on it's network. This would be the same as for a wired network. Also, my fellow student Mithru explains it in his paper.

How do multiple devices/routers in different networks but same physical area not interfere with each other?

Have you ever been in a tall apartment building? If you have you probably saw dozens of networks available. It would be fair to assume that there are close to a hundred (or more) devices within wifi reach. Most likely, not all of this devices are talking at once, in fact, most devices rarely talk and constantly listen. Still, it most happen that once in a while two or more devices talk at the same time. How can we possibly communicate in such a loud environment?

This is a broad question and there are a couple of things that come into play, lets start with signal loss. Radio signals decay dramatically over distance. In fact signal strength is inversely proportional to the square of the distance. This rule applies to much more than signals in space but to anything growing over space and it is known as the Inverse-square law: isl

This explains why we don't see all networks in the world every time we try to connect to our Wifi. This also means that some of the networks we see in our apartment building have such a weak signal by the time they reach us that the interference noise is not as damaging to our signal.

It is time to talk about of the biggest players in radio transmission: Frequency. I know I have touched the term before but this time lets go a deeper.

What do cats on the internet and the light from far away starts have in common?
If you use wifi (or cell signals) and if your answer is that they both travel using the electromagnetic spectrum, then you got it right!

Light travels using the electromagnetic spectrum, so does wifi, and AM radio... and even x-rays. In fact the main difference between all of these is just the frequency.

The following image represents the electromagnetic spectrum. On one side we have gamma rays with super short wavelengths (very high frequencies), on the opposite we have the very long wavelengths (slow frequencies) of AM radios. Along the middle of the spectrum we have light.

electromagnetic spectrum(https://luxes.es/basics-of-lighting/?lang=en)

Lets go deeper into the concept, lets focus just on what we call 'light' or to be more precise, the visible section of the electromagnetic spectrum. What is the difference between blue light and green light? Again, it is just the frequency of each wave.

Now to more practical concepts; you probably also know that if you shine blue light and red light you end up with a purplish/magenta color. In this case, both waves are interfering with each other and our eye ends up decoding magenta. But what happens if you use a filter to block all red light? Well, we are back to blue only.

The reason talking about light is useful is because we are familiar with it, the same rules apply to Wifi. We also have filters to remove unwanted frequencies form incoming messages.

Frequency Bands - Wifi 2.4GHz and 5GHz

In the early days of wifi, modems would only operate on the 2.4GHz range frequencies. By now we know that if Wifi mainly uses Frequency Shift Keying (FSK), the devices will transfer information by adjusting the frequency; Which means that they need a range of frequencies (not just one) to operate successfully.

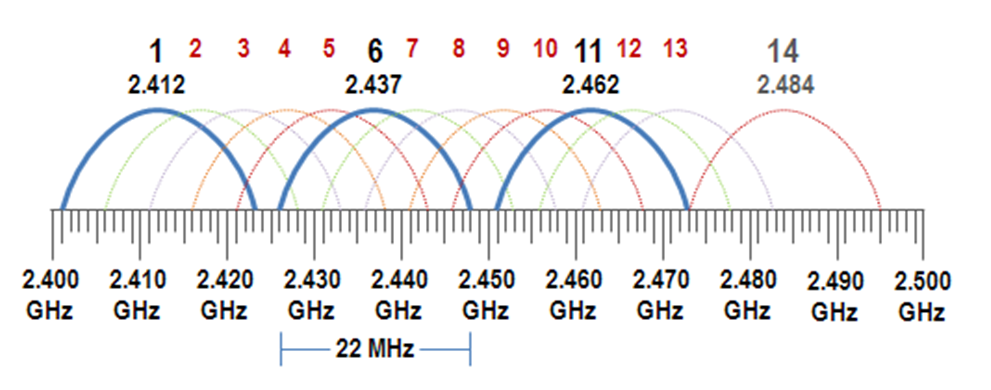
The actual spectrum for 2.4GHz Wifi covers from 2.4GHz up to 2.5GHz, this range can be subdivided into three bands that are isolated form each other. Isolation is key to guarantee a clean, fast transmission.

bands http://support.acs-linksystems.com/knowledgebase/using-softlink-classroom-management-software/

From the diagram above, you can see there is actually some white space between the blue frequency bands. This is purposely left blank as a guard band, to prevent further interference.

As you can imagine, having only three frequency bands for Wifi devices to communicate makes the airspace crowded. On top, we have other devices that don't operate using the IEEE 802.11 protocol, e.g. microwave ovens which radiate noise in those frequencies to warm liquids in our food.

For this reason Wifi is now also available on the 5GHz frequency bands. This time, instead of only having 3 possible bands it has 14. This also allows for the possibility of reducing the number of bands and increasing the bandwidth of each. This means that more information can be transferred in the same space, making Wifi speeds much faster.

bands5ghz(https://www.networkcomputing.com/wireless/dynamic-frequency-selection-part-3-channel-dilemma/438580919)

Once in a while it will happen, there is too much interference and the message cannot be decoded. In this case there is no other option but to ask for it again. Retransmission can cause nightmares to you Wifi connection, but next time your internet seems unbearably slow, just remember that cats and far away galaxies have much more in common than we usually think.

I hope this article was helpful in explaining the magic of one of our most used every day technology. One that you are most likely using as we speak. Any further questions? Feel free to include them below.

Sometimes the only thing you can do is failNOT YET RATED by Sebastian Morales

Sometimes the only thing you can do is failNOT YET RATED from Sebastian Morales on Vimeo.

[Automating video hw 2. Filing at OpenCV with python]
ometimes the only thing you can do is fail
Sometimes the only thing you can do is fail
Sometimes the only thing you can do is failSometimes the only thing you can do is failSometimes the only thing you can do is failSometimes the only thing you can do is failSometimes the only thing you can do is failSometimes the only thing you can do is fail


Additional Automating Video Videos

11235813213455 by Sebastian Morales

11235813213455

Using youtube-dl I downloaded 10 different videos resulting from the search "fibonacci" in youtube. 

Then using moviepy and a short python script I merged them using the fibonacci sequence as each clip duration. 

import moviepy.editor as mp
import random;
from random import randint

clips=[]
start=0;
duration=1;
oldDuration=0;
end= start+duration;

for i in range(0,11):
    video=mp.VideoFileClip(str(i)+".mp4")
    video = video.resize((1280,720))
    start=randint(0,int(video.duration-duration))
    clip=video.subclip(start,(start+duration))
    clips.append(clip)
    tempOld=duration
    duration+=oldDuration
    oldDuration=tempOld

composition=mp.concatenate(clips)
composition.write_videofile('fibonacci.mp4', codec="libx264", temp_audiofile='temp-audio.m4a', remove_temp=True, audio_codec='aac')

There is also a shorter version of the piece named 112581321

The original videos:

Original videos:
https://www.youtube.com/watch?v=SjSHVDfXHQ4
https://www.youtube.com/watch?v=wTlw7fNcO-0
https://www.youtube.com/watch?v=7t_pTlH9HwA
https://www.youtube.com/watch?v=ahXIMUkSXX0
https://www.youtube.com/watch?v=RqqErDSLtwE
https://www.youtube.com/watch?v=4LQvjSf6SSw
https://www.youtube.com/watch?v=2pbEarwdusc
https://www.youtube.com/watch?v=ax205fJ17Zw&t=947s
https://www.youtube.com/watch?v=9ZyVEe1ORTE
https://www.youtube.com/watch?v=P0tLbl5LrJ8


Additional Automating Video videos

Hora de ver una peli, luces! by Sebastian Morales

Extracto
Usando wireshark para monitorear trafico y apagar las luces del cuarto cada vez que visito Netflix. Tercera tarea par la clase de Understanding Networks en ITP, dirigida por Tom Igoe. 

WAIT... WHAT'S WITH THE SPANISH?

En esta ocasión aprendimos un poco sobre herramientas de diagnostico como wireshark y hervibore. Ambas son herramientas que nos permiten observar paquetes y el flujo en nuestra red. 

Wire shark también tiene una interface desde terminal por lo que puede ser programado para interactuar con otros programas. En este caso, lo conecté de tal manera que cada vez que visito el sitio de netflix, las luces de mi cuarto se apagan. 

luces.gif

Pero no nos adelantemos...

Que es Wireshark?
Wireshark es un analizador de protocolos, no solamente internet aunque en este caso para eso lo vamos a usar. El programa es open source y también tiene una versión (tshark) para operar desde la terminal.

https://es.wikipedia.org/wiki/Modelo_OSI

https://es.wikipedia.org/wiki/Modelo_OSI

Se cierta forma Wireshark puede interpretar y desenvolver distintas capas del modelo OSI (modelo de interconexión de sistemas abiertos).

No tanto al grado de poder leer los 0 y 1 en los cables, sino empezando por la capa de Datos, nombrando las direcciones MAC y switches. Después podemos entrar en la capa de la red, ver las direcciones IP e información acerca de la información que vamos a pasar. Después viene la capa de transporte; puertos y protocolos, TCP, UDP, DNS?  Sigue el nivel de sesión, aquí podemos ver info sobre nuestra connexion con otra computadora (servidor). Por fin llegamos al nivel presentación, esta capa se encarga de que no importa como la información fue generada o transmitida, siga teniendo significado para quien la recibe (aquí ya estamos hablando del contenido de la información), ni siquiera estamos hablando de lenguajes de programación, más bien tipos de info (image, audio, ascii o Unicode?). Por fin llegamos al nivel de la aplicación, aquí nos enfocamos hacia como la información se relaciona con la aplicación que estamos usando, en este caso sería nuestro navegador y la información probablemente esta en un formato de javascript y html.

Ok, hora de aterrizar esto un poco. Vamos a ver un ejemplo de como usar wireshark. 
Wireshark te permite analizar tu conexión usando el modo promiscuo, lo que significa que te permite analizar todo el trafico que circula por tu red local. Como te puedes imaginar esto puede representar un gran riesgo para todos, por lo que ciertas redes estan configuradas de tal manera que no soportan este modo de promiscuidad. Las redes de NYU están configuradas de dicha forma, por lo que desde la escuela solo podremos observar nuestro propio tráfico. 

Wireshark te permite observar mucho tipos distintos de protocolos a la vez, a veces esto se puede volver demasiado por lo que también podemos usar filtros para solo ver ciertos tipos de paquetes. En la siguiente imagen tengo el siguiente filtro: "http.response.code" esto solo va a mostrar las interacciones que respondieron con http. Podría combinar filtros, por ej: "http.response.code && ip.dst == 172.16.250.205" para ver solamente el trafico http dirigido a mi. En este caso, como las redes de NYU no permiten el modo promiscuo, se de entrada que el trafico de respuesta es solo para mi. Pero te puedes imaginar como esto puede ser útil si estas administrando multiples dispositivos.  

WIreshark http response sample

WIreshark http response sample

Antes de que me salte a lo siguiente quiero mencionar dos cosas:
1. En la parte inferior derecha, podemos ver que solo estamos observando el 0.0% de el trafico total, o 254 de 6,461,980 de los paquetes registrados, esto es por que muy poco trafico es una respuesta en http.
2. Hablando de http, aqui podemos ver por que no es la mejor idea. Si nos fijamos en la linea subrayada, donde dice "Line-based text data:" podemos leer el texto css tal cual. En este caso es solamente info del estilo, pero podría ser info más importante, incluyendo passwords y usuarios. Esto es lo que vería cualquier extraño analizando el trafico de la red (de no ser por que la red de NYU no esta configurada de esa manera). En otras palabras, usa https de ser posible.

Ok, ok, pero como se conecta esto con las luces?
El primer paso es deshacernos de wireshark version gráfica para poder fácilmente conectarlo con otros programas y tener un poco mas de control. Wireshark tiene una versión de terminal llamada tshark. La sintaxis en tshark es un poco distinta, en mi opinion es mas sencilla, por ejemplo: 

Screenshot 2017-10-16 22.24.41.png

"-i" quiere decir que vamos a escuchar en una interface, "en0" es la interface que queremos escuchar. ' -f" ' quiere decir que estamos apunto de nombrar los filtros de captura que queremos usar. Aquí podemos separar los filtros por lineas, en el caso de la derecha, ejecutando en siguiente comando va a listar todos los paquetes entre mi compu (172.16...) y facebook.com.


Screenshot 2017-10-16 22.30.40.png

Si quieres usar condicionales dobles puedes hacerlo nombrándolos en la misma linea, por ejemplo: "host www.facebook.com or www.adorevolution.com". Esto va a escuchar a todo trafico entre mi compu (172.16...) y fb, o entre mi compu y adorevolution.com 


Ok, ok, pero como se conecta esto con las luces??
Hasta ahora sabemos como filtrar un poco el tráfico para solo ver lo que queremos. En realidad en el caso de las luces no estamos tan interesados en el contenido del trafico sino en el hecho de que existe cierto tráfico. En pocas palabras, si detectamos tráfico podemos inmediatamente detener el program y encender las luces. Para detener el programa podemos usar la bandera (flag??) "-c". Tenemos que acompañarla con el número de paquetes que queremos escuchar antes de terminar. En mi caso decidí usar "-c 10". 

Screenshot 2017-10-16 22.58.27.png

Ok, ok, pero como se conecta esto con las luces??
Antes de seguir, debería confesarte de que no voy a entrar mucho en detalle. Quizás uno de estos días escriba una guía mas a detalle.

Mientras tanto, mis luces están conectadas a unos switches "inteligentes". Normalmente, los switches se controlan con el control remoto. Pero con una arduino y un radio fácilmente se puede leer y replicar las señales del control. Si conectamos esto a una raspberry Pi zero, tenemos una casa inteligente! 

En la rpi0 hice un servidor local, si visitas ciertas URLs (por ejemplo: 192.168.1.10:8000/luzPrendida) el arduino prende o apaga las luces. De esta forma tambien se puede conectar a Siri o a Google Home/okgoogle. 

Ok, ok, pero como se conectan las luces con wireshark?
Hasta ahora, tenemos un programa de wireshark que ejecuta desde la terminal, monitorea nuestro trafico y cuando visitamos cierta pagina web se cierra de manera automática. También tenemos un servidor que cuando recibe ciertas solicitudes prende o apaga las luces. 

shellscript.png

Para conectar los dos procesos simplemente escribí un shell script. Si te fijas, también use el filtro de mac address, esto para prevenir que mi roommate apague mis luces cada vez que vaya a netflix. 


Me salté un par de pasos, sobre todo al final, pero creo que si me meto en los detalles esto ya no tendría mucho que ver con wireshark o con la tarea en general.

Y la verdad, tengo ganas de ver una película...

traceroute mapeando mi web by Sebastian Morales

Wait... what's with the spanish?

Esta es la segunda tarea para la clase de "Understanding Networks" en ITP. La tarea consiste en utilizar tracroute para entender como nuestros paquetes viajan en la red, como empiezan a aparecer nodos y caminos comunes.  

Que es traceroute (tracert en Windows)? 
Es un commando en la consola (terminal) que podemos usar como herramienta de diagnostico para observar como viajan nuestros paquetes desde nuestra computadora hasta la página web que queremos acceder. Por donde paran, cuanto tiempo toman y como saltan de router en router. 
 

Inspirado por la red que es el internet, quería representar las conexiones no tanto de manera geográfica pero de forma mas abstracta, a la vez, quería mostrarlas casi de forma orgánica. Como si estuviera analizando un organismo vivo bajo microscopio. Un organismo que no es estático y que se adapta y cambia con el tiempo.

Aclaración: Tom hizo que me diera cuenta de un par de cosas en las cuales no fui muy claro. A qué me refiero con querer mostrar las conexiones "casi de forma orgánica"? Me refiero a dos cosas, a que normalmente estamos acostumbrados (por lo menos yo) a pensar de cosas de forma espacial, coordenadas, posiciones geográficas, o marcas (pasando el soriana, dos cuadras a la izquierda). Pero el internet, a pesar de ser algo que existe en cables y computadoras, no siempre funciona de manera geográficamente eficiente, al menos no a simple vista. A veces vemos que nuestros pedidos (requests) viajan de Nueva York a Europa para regresar inmediatamente a Estados Unidos, dando saltos de servidor en servido que uno no puede explicar viendo un mapa. A veces, y aquí voy por mi segundo punto, vemos que nuestros pedidos viajan en cierta ruta, pero segundos después, el mismo pedido puede tomar una ruta completamente distinta. Cuando estaba pensando en como visualizar esto de manera gráfica quería que el sistema fuera flexible, que pudiera adaptarse y crecer, "casi de forma orgánica" para dar reflejo a la flexibilidad de el internet. 

Pero me estoy adelantando...

Archivo json de conexiones.

Primero escribí un programa usando Node.js para realizar los traceroutes y guardar la información recuperada en un JSON. Básicamente una lista declarando que ip esta conectada con que ip. 

Para que mis búsquedas tengan un poco mas sentido para el observador, la primera (la de mi compu), y la última (la de la pagina de interés) direcciones ip llevan nombre.
 

Una vez que logré guardar todas las conexiones en el archivo, me puse a trabajar un poco en como visualizar esto. Para esto decidí usar P5.js, una biblioteca de javascript muy fácil de usar sobre todo para crear visuales en la web.

Sin mucho esfuerzo pude crear este desastre:

Primera representación de conexiones.

Desastre por que no es nada fácil de leer y te deja hasta más perdido que si te pusieras a leer el json con las conexiones en lista.  

Si te pones a pensar en como organizar todas estas conexiones de manera automática (o inclusive manual) te darás cuenta de que no está tan fácil. Sobre todo cuando el sistema se vuelve más complejo. Sin embargo, este tipo de conexiones ocurren de manera natural, tanto en la naturaleza como en infraestructuras creadas por nosotros, lo que quiere decir que se tiene que poder programar de alguna manera.

Curioseando por la web, me topé con este sketch escrito por Tazal que tiene exactamente el estilo de lo que tenía en mente. Solo que a diferencia de la red del internet, no todos los nodos se conectan a sus vecinos, sino que existen nodos líder con muchas más conexiones.

Organic Blob por Tazal, Modificado para P5.js
Dale click para ver que pasa.

El código de Tazal tine tres reglas muy sencillas:

  1. Todos los nodos se mueven hacia el centro
  2. Si los nodos, entre si, están a menos de cierta distancia crean conexiones
  3. Si los nodos, entre si, están demasiado cerca se repelen

Estas tres reglas también las puedo usar yo, solo que la única diferencia es que las conexiones no se crean por cercanía sino por conexiones entre las direcciones ip. 

Una vez aplicada la lógica salió esto: 

desdoblando

En la siguiente imagen me conecté desde dos redes distintas a adorevolution.com y a google.com. Ambas conexiones inician desde direcciones marcadas "pedregal". Se puede observar como google es mucho mas eficiente y llegar a sus servidores es mucho mas rápido.

map2.jpg